
.png?fit=max&auto=format&n=J3TfNmZhqEoKcaaO&q=85&s=468b5adb026aa33181cc81ab54ab68db)
- Purpose: Templates for multi-page reports with data visualization.
- Cost: Free to apply. Credits used for content generation.
-
Workflow:
- Visit
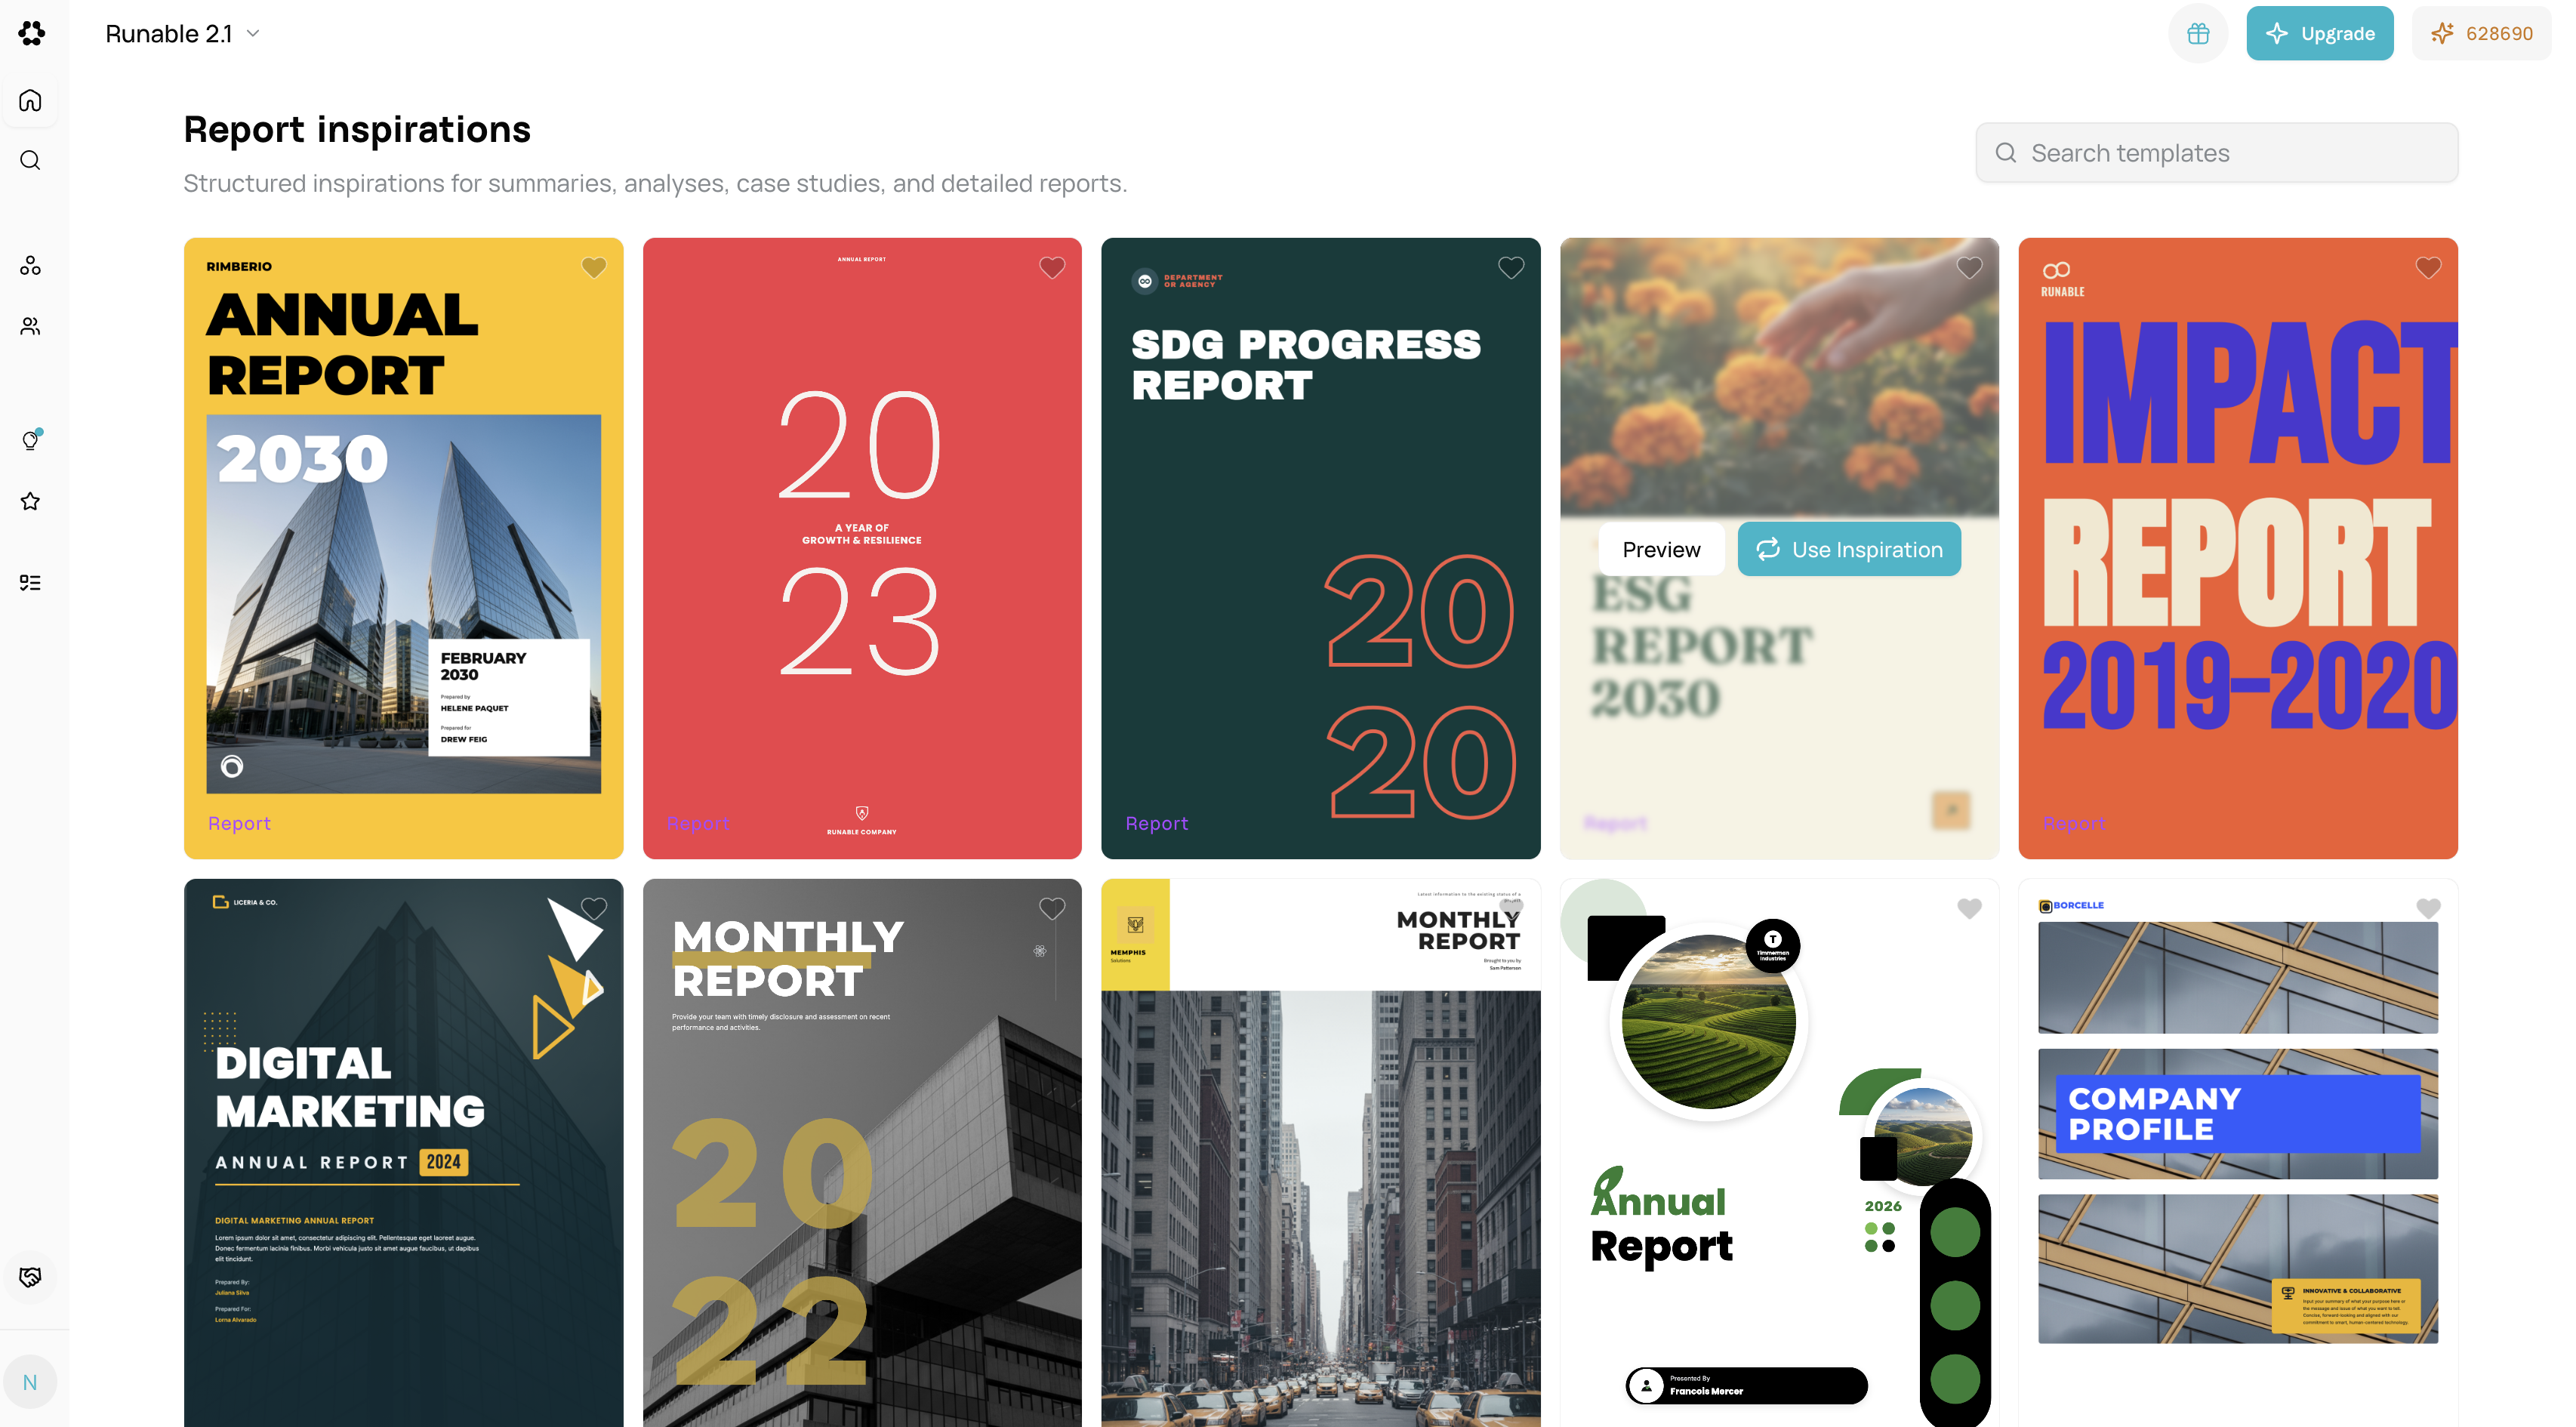
/inspirations/report. - Preview report structure and layouts.
- Select a report template.
- Describe the report topic (e.g., “Q4 Sales Analysis”).
- AI generates report chapters.
- Edit report sections—add data, charts.
- Visit
-
Examples:
- Executive Summary: High-level overview.
- Data-Driven: Chart-heavy layouts.
- Academic Style: Formal structure.
- Financial Report: Ledger + analysis format.
Inspiration Types by Artifact